❄ ColdMac
Status 
You are viewing a static, archived copy of the ColdMac 2014 project. The data is no longer live.
You can go back to the ColdMac Project main page.
Extremes
Ambient Temperature High: 78.9° F
Ambient Temperature Low: 2.2° F
Relative Humidity High: 86.1%
Relative Humidity Low: 22.1%
Dew Point High: 60.3° F
Dew Point Low: -7.1° F
Processor High: 117° F
Processor Low: 32° F
Graphics Chip High: 120° F
Graphics Chip Low: 0° F
Logic Board High: 109° F
Logic Board Low: 0° F
Hard Drive High: 106° F
Hard Drive Low: 37° F
Specs
Machine: Late 2006 iMac 20"Processor: Intel Core2Duo 2.16 GHz
RAM: 2 GB
Hard Drive: 80 GB
Wifi: 802.11 a/b/g/n
Mac OS X 10.6.8 (Snow Leopard)
Apache 2.2.24 / PHP 5.3.26 / MySQL 5.5.29
Official “Limits”
Operating Temperature: 50° to 95° FStorage Temperature: -40° to 185° F
Relative Humidity: 5% to 95%
Previous Winters
ArchivesAmbient
Humidity
Dew Pt
Processor
Graphics
Logicboard
Hard Drive
Final 24 Hours
Daily Temperature Range
Sponsor
Practical Design Group has donated an awesome USB Thermometer & Hygrometer (THUM) to this project. As you can see, it works great! The ambient temperature, relative humidity, and dew point readings are coming from the THUM.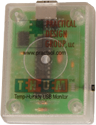
About This Mac
ColdMac is an old Apple computer, that lives in my shed, and tracks it's own internal and external temperature, and also hosts this website about itself.
The shed this Mac lives in is very cold. It is not insulated, the door has no seal, and there are two vents in the walls. So while the shed may keep the Mac a little cooler on sunny warm days, it does nothing to keep it warm on very cold nights.
This year, the Mac is an older intel iMac. Intel Macs are loaded with internal temperature sensors, so I picked the 4 I liked best. The three external readings are taken from the THUM sensor (see above). Every 10 seconds, a php shell script polls all sensors, and loads the data into a MySQL database.
This web page is filled with interesting and LIVE updating information about the Mac. This page uses jQuery to load up to date thermal statistics every 10 seconds. It also updates the graphs every minute. You don't ever have to refresh this page.
The hardest part of making this project is always the charts. Everything else is pretty bread-and-butter stuff. The making the charts in real time, from real data, is always a complicated project. This year, I switched from flash-based charts to javascript/html5 based charts. I did this so that they would be visible on iOS devices, and also because flash runs down peoples batteries, and that's just rude.